Dashboard design
The Most Important Metrics to Track on Your Sales Dashboard
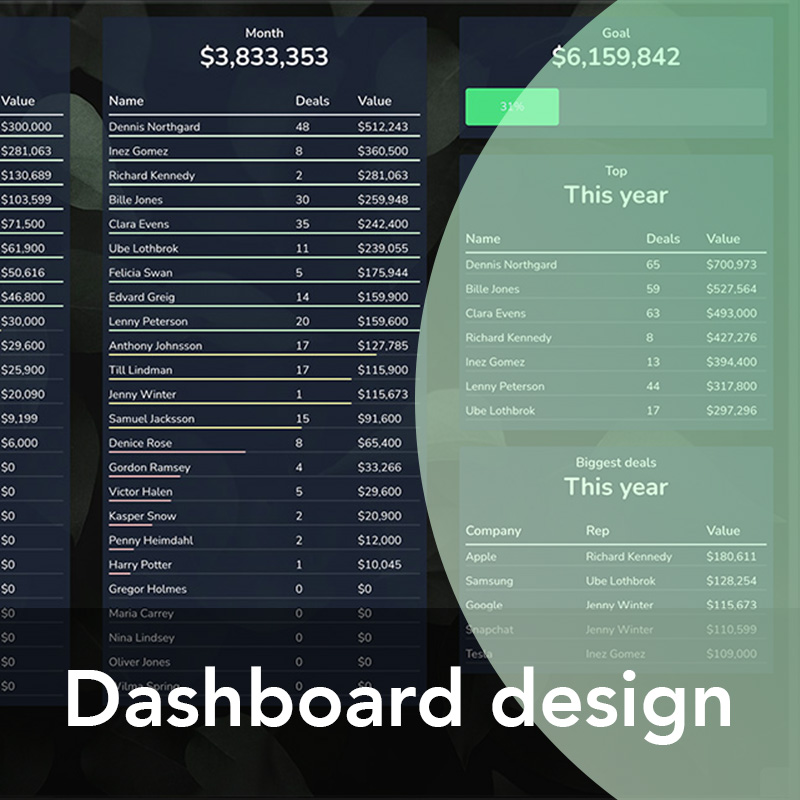
As a sales manager, having a comprehensive view of your team’s performance is essential to making sure they’re successful. A great way to do that is by keeping track of key metrics on a sales dashboard. By tracking the right metrics and understanding their meaning, you can make data-driven decisions and optimize your team’s performance. Let's take a look at the most important metrics to track on your sales dashboard.
Sales Pipeline Velocity
Sales pipeline velocity entails measuring the rate at which opportunities move through each stage in the sales process from lead to close. Tracking this metric allows you to identify any bottlenecks in the pipeline as well as any areas that are working well for your team. It also enables you to measure progress and adjust strategies if necessary. Additionally, it helps you understand how long it takes prospects to convert, so you can plan accordingly when setting goals for the team.
Closed Deals
This metric measures the number of deals won by your sales reps over a certain period of time – whether that’s monthly or quarterly. It helps you monitor how well they’re performing against their quota and gives an indication of overall success. It also enables you to understand which products are selling best and identify any potential issues with product development or marketing messaging that could be contributing factors in fewer closed deals than expected.
Average Deal Size
The average deal size measures the average amount spent by customers per transaction over a specified period of time. Keeping tabs on this metric allows you to understand what kind of revenue is coming in from each sale and can help inform pricing decisions for future transactions. It also gives insight into how effective upsells or discounts have been and highlights opportunities for expanding offerings or launching new products that could increase overall revenue for your company.
Conclusion:
Having access to key performance indicators (KPIs) on a central dashboard is invaluable for sales managers looking to gain insight into their team’s performance, identify areas where improvements need to be made, and develop strategies that will help them reach their goals faster. The most important metrics include sales pipeline velocity, closed deals, and average deal size — all of which provide crucial information about how well (or poorly) teams are performing against quotas and give insight into customer buying patterns and preferences that should be taken into consideration when setting objectives for future periods. Understanding these key metrics will enable sales managers to make informed decisions about their teams' activities without wasting valuable time analyzing data manually each month or quarter.